Your cart is empty
Shop our products
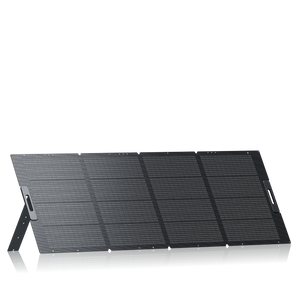
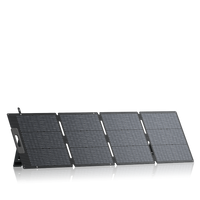
Those of you interested in the BLUETTI PV350 solar panel may be wondering just how much energy (kWh) it is capable of producing.
The thing is, this is a relative question, and one answer won't necessarily satisfy everyone.
In this article we aim to talk about energy production, how it works, and what you can expect your PV350 to produce based on the state in which you live.
Let's get started
Energy Vs Power
Before we get started we thought it important to clarify the difference between energy and power. Although most know the difference, we still see many people confusing the two.

To understand the difference between power and energy, it is often best to use an analogy.
Power is the flow rate of the water while energy is the amount of what collected int he bucket.
All solar panels come with a power rating, defined in watts. The energy that solar panels generate is most frequently defined in kWh.
"The kilowatt-hour is a unit of energy equal to one kilowatt of power sustained for one hour and is commonly used as a measure of electrical energy."
How much energy does the BLUETTI PV350 solar panel produce?
In order to determine how much energy your solar panel will produce, you need its nameplate rating (it's wattage).
But just as important as the nameplate rating, is knowing the amount of solar irradiation predicted to be hitting the panel.
This is often defined in peak sun hours.
"A peak sun hour equates to 1 hour in which the sun’s solar irradiance (sunlight) produces an average of 1000W (energy) per square meter (roughly 10.5 feet). In other words: 1 peak sun hour = 1000 W/m² of sunlight per hour." - Climatebiz
We can't stress how important this point is.
Without knowing your areas peak sun hours, you cannot determine how much energy your solar panel will produce.
Very often someone will ask, how much energy will a 300 watt solar panel produce?
Well, the answer is impossible to give without knowing the location of the panel.
For example, a BLUETTI PV350 solar panel will produce totally different amounts of energy in Los Angeles Vs London.
To display this look at the following data:
- California: System output may range from 536 to 577 kWh per year.
- London: System output may range from 250 to 320 kWh per year.
See the massive difference in solar production?
Knowing where a solar panel will be situated is paramount to calculating energy production.
How to calculate energy production?
The NREL created a solar calculator, which is about as accurate as it's going to get when it comes to predicting energy production. Check the calculator out here.
If you want an online calculator that uses the same data as the NREL but also provides you predictions on area required/number of panels needed, you can use the solar calculator from Climatebiz.
BLUETTI PV350 energy production per state

Below we have created a various tables outlining the expected energy production of the BLUETTI PV350 based on the sate you live in.
California
| Month | Solar Radiation
( kWh / m2 / day )
|
AC Energy
( kWh )
|
|---|---|---|
| January | 3.47 | 30 |
| February | 4.08 | 31 |
| March | 5.20 | 44 |
| April | 6.32 | 51 |
| May | 7.47 | 61 |
| June | 8.24 | 63 |
| July | 8.15 | 64 |
| August | 7.83 | 61 |
| September | 6.80 | 52 |
| October | 5.63 | 46 |
| November | 4.11 | 33 |
| December | 3.31 | 29 |
| Annual | 5.88 | 565 |
New York
| Month | Solar Radiation
( kWh / m2 / day )
|
AC Energy
( kWh )
|
|---|---|---|
| January | 2.90 | 27 |
| February | 3.92 | 32 |
| March | 4.57 | 41 |
| April | 5.41 | 45 |
| May | 5.41 | 46 |
| June | 5.96 | 48 |
| July | 6.17 | 51 |
| August | 5.88 | 49 |
| September | 5.16 | 42 |
| October | 4.06 | 35 |
| November | 3.06 | 26 |
| December | 2.41 | 22 |
| Annual | 4.58 | 464 |
Idaho
| Month | Solar Radiation
( kWh / m2 / day )
|
AC Energy
( kWh )
|
|---|---|---|
| January | 2.55 | 23 |
| February | 3.76 | 31 |
| March | 5.06 | 46 |
| April | 6.52 | 55 |
| May | 6.69 | 57 |
| June | 7.22 | 58 |
| July | 7.62 | 62 |
| August | 6.98 | 57 |
| September | 6.05 | 49 |
| October | 4.34 | 37 |
| November | 2.96 | 25 |
| December | 2.09 | 19 |
| Annual | 5.15 | 519 |
Washington
| Month | Solar Radiation
( kWh / m2 / day )
|
AC Energy
( kWh )
|
|---|---|---|
| January | 3.33 | 31 |
| February | 4.23 | 34 |
| March | 4.83 | 43 |
| April | 5.65 | 47 |
| May | 5.94 | 50 |
| June | 6.34 | 50 |
| July | 6.15 | 50 |
| August | 5.75 | 46 |
| September | 5.36 | 43 |
| October | 4.43 | 38 |
| November | 3.48 | 29 |
| December | 2.98 | 27 |
| Annual | 4.87 | 488 |
Final thoughts
We hope you enjoyed this article, and have a better idea of what to expect when it comes to energy production.
At a later stage we may update this list to include more states, but for now you can have a rough idea of what to expect.
Shop products from this article
Be the First to Know
You May Also Like

What Does a 30% Federal Solar Tax Credit Mean and How to Apply?
Governments around the world are offering programs that encourage homeowners to switch to solar energy. Among the most notable programs is the 30% Federal Solar Tax Credit. It reduces your...

Deadly Flooding Devastates U.S. South and Midwest — What You Need to Know


